States of Change
The Demographic Evolution of the American Electorate, 1974–2060

The demographics of the United States are projected to become much more diverse in the coming decades and will have significant effects on the nation's voting electorate in all 50 states.
- PRINT:
 SHARE:


- Endnotes and citations are available in the PDF and Scribd versions.
- Download the report:
PDF - Download introduction & summary:
PDF - Read it in your browser:
Scribd

See also: Interactive: The Demographic Evolution of the American Electorate, 1980–2060 by Ruy Teixeira, William H. Frey, and Robert Griffin
10 big trends that are transforming America
The States of Change: Demographics and Democracy project is a collaboration supported by The William and Flora Hewlett Foundation that brings together the Center for American Progress, the American Enterprise Institute, and demographer William H. Frey of the Brookings Institution. The project’s goals are:
- To document and analyze the challenges to democracy posed by the rapid demographic evolution from the 1970s to 2060
- To project the race-ethnic composition of every state to 2060, which has not been done for 20 years
- To promote a wide-ranging and bipartisan discussion of America’s demographic future and what it portends for the nation’s political parties and policy
This report presents the first tranche of findings from this project—including detailed analyses on the nation as a whole and on every state—which we hope will both inform and provoke discussion. We outline 10 broad trends from our findings that together suggest the scale of the transformation our country is living through and the scope of the challenges it will face in the future.
These changes admit to a wide variety of interpretations, and as with any report as extensive as this one, it should not be surprising that there are some differences in interpretation among the participating institutions. We believe, however, that differing interpretations are to be welcomed and that they will be useful in stimulating discussion both within and outside our project on the implications of demographic change.
Trend 1: The rise of majority-minority and near-majority-minority states
The scale of race-ethnic transformation in the United States is stunning.
In 1980, the population of the United States was 80 percent white. Today, that proportion [of non-Hispanic whites - JB] has fallen to 63 percent, and by 2060, it is projected to be less than 44 percent. Hispanics were 6 percent in 1980, are 17 percent today, and should be 29 percent by 2060. Asians/Others were just 2 percent in 1980, are 8 percent today, and should be 15 percent by 2060. Blacks, however, should be stable at 12 percent to 13 percent over the time period.
Nothing captures the magnitude of these shifts better than the rise of majority-minority states. Right now, there are only four majority-minority states: California, Hawaii, New Mexico, and Texas. But with the ongoing demographic transformation of the country, our States of Change projections find that this will become more and more common. A table of when we expect these newly minted, majority-minority states to emerge is displayed on the following page. Note that since minorities are not monolithic in their policy or political preferences and because, in any case, those preferences may change over time, any assumption that majority-minority states will adopt a unified policy or political orientation would be unwise.
The next two majority-minority states, Maryland and Nevada, should arrive in the next five years. After that, there should be four more in the 2020s: Arizona, Florida, Georgia, and New Jersey. In the 2030s, these states should be joined by Alaska, Louisiana, and New York, and in the 2040s, these states should be joined by Connecticut, Delaware, Illinois, Mississippi, Oklahoma, and Virginia. The 2050s should round out the list by adding Colorado, North Carolina, and Washington. By 2060, that should bring the number of majority-minority states to 22, including seven of the currently largest states and 11 of the top 15. Together, these 22 states account for about two-thirds of the country’s population.

Just as interesting are the many states that are projected to be near majority-minority by 2060. The following 10 states should be more than 40 percent minority by 2060, including some seemingly unlikely ones: Alabama, Arkansas, Kansas, Massachusetts, Michigan, Oregon, Pennsylvania, Rhode Island, South Carolina, and Utah. Data for each state can be seen in Table A.2 (available in the PDF), which provides the percent minority for every state for four years: 1980, 2014, 2040, and 2060.
Trend 2: The diversification of eligible voters
If we are interested in how demographic change has affected, and should continue to affect, the American electorate and therefore the climate for public policy, we have to look beyond trends in the overall population and toward a subset of the population: eligible voters, or EVs, those of voting age who are also citizens. The population of EVs tends to be whiter than the overall population because: (a) children tend to be more diverse than older age groups but are not included, of course, in the EV population; and (b) new minorities tend to have high rates of noncitizen adults, who are not eligible to vote. This disjuncture between the overall population and EVs has increased since 1980.
In 1980, 16 percent of EVs were minorities, 4 percentage points lower than the minority share of the overall population. Today, that figure has nearly doubled to 30 percent of EVs, but it is now 7 points lower than the minority share of the overall population. Thus, both the population and EVs have diversified substantially, the latter more slowly than the former.
However, the overall population-EV gap should narrow significantly in the future, as more of the growth in Hispanics and Asians comes from fertility—children of immigrants are citizens and therefore EVs once they reach age 18—rather than immigration. By 2060, the EV population is projected to be 54 percent minority, only a little more than 2 points lower than the minority share of the overall population. We should note that assumptions about future immigration are a particularly difficult part of the projections process. If the assumptions we have made here are off, the gaps could differ significantly from what we have estimated.

Of course, this trend is likely to vary by state. In fast-growing states such as Texas, Arizona, Nevada, and Florida, the gap-narrowing pattern should be very strong. But in slow-growing, more static states such as Ohio, North Dakota, and Maine, the gap may even widen slightly over time. The minority levels of EVs in each state for 1980, 2014, 2040, and 2060 are shown in the table on page 4.
Trend 3: The lagged diversification of actual voters
Actual voters, or AVs, relative to EVs have historically underrepresented minorities. In 1976, for example, 15 percent of EVs were minorities compared with 12 percent among AVs. We would have expected this 3-point gap to widen since 1976, since almost all of the increase in minority EVs has come from Hispanic and Asian minorities, whose turnout tends to be particularly low. Interestingly, however, this has not been the case, at least in presidential elections. In 2012, 29 percent of EVs were minorities, compared with 26 percent of AVs—an identical 3-point gap.
A clue to this mysterious stability may be found in the turnout rates by race in the 2012 election. Looking at race, turnout of white EVs in 2012 was 64 percent, and turnout of black EVs was 67 percent, the first time reported turnout among blacks was higher than among whites. In contrast, turnout among Hispanics was just 48 percent, and turnout among Asians was 47 percent. The high turnout figure for blacks is the key here. In fact, there has been steadily rising black presidential election turnout since 1996: 53 percent in 1996, going up to 67 percent in 2012. This rising turnout among blacks—which has turned underrepresentation of blacks in presidential elections into slight overrepresentation—has offset the increasing proportions of Hispanics and Asians, who have relatively low turnout, to help keep the gap between minority EVs and minority AVs stable.
However, congressional elections are a different matter. Turnout in congressional elections has been remarkably stable among all minorities, including blacks. This has increased the turnout drop-off among minorities between presidential and congressional elections. Turnout drop-off among minorities was 9 points from 1976 to 1978 and a modestly larger 11 points between 1996 and 1998, but it rose steadily after that, to 19 points by the 2010–2012 period.*
These patterns have affected the extent to which minorities are underrepresented in congressional elections. The congressional elections of 2002, 2006, and 2010 have seen the highest post-1974 differences between the minority share of voters and the minority share of EVs, ranging from 4.5 percentage points to 5.9 percentage points.
Trend 4: The rise of post-Baby Boom generations
The generational makeup of the U.S. population has changed and will continue to change steadily throughout the 1980–2060 period via the process of generational replacement. In 1980, 23 percent of the population came from the Greatest and Lost Generations, born before 1928; 20 percent came from the Silent Generation, born from 1928 to 1945; 33 percent came from the Baby Boom Generation, born from 1946 to 1964; and 25 percent came from Generation X, born from 1965 to 1980. Today, the Greatest Generation is down to around 1 percent, the Silent Generation is at 9 percent, Baby Boomers are at 24 percent, and Gen Xers are at 21 percent. They are joined by two generations that were not present in 1980: the Millennials—born from 1981 to 2000—and the Post-Millennials—born from 2001 to 2020. The former are 27 percent of today’s population—the largest single generation—and the latter are 18 percent.
By 2060, the Greatest, Silent, and Baby Boom generations will no longer be on the scene. Gen Xers will be down to 8 percent of the population, Millennials will be at 21 percent, Post-Millennials and Post Millennials 2—born from 2021 to 2040—will be at 24 percent each, and Post-Millennials 3—born from 2041 to 2060—will be at around 22 percent.
Reflecting these shifts, the generational makeup of the eligible electorate has changed and will continue to change dramatically over time, though it will considerably lag behind the changes in the overall population. This is because members of a given generation do not enter the eligible electorate until they are 18 years old; therefore, a generation’s impact among EVs does not begin until 18 years after the first birth year of the cohort and is not fully felt until 18 years after the last birth year of the cohort. At that time, the generation’s weight among EVs peaks and will be at a level significantly above its overall population weight.
Keeping this in mind, the 1980 eligible electorate still contained a large contingent—32 percent—from the Greatest and Lost—born before 1928—generations, along with 28 percent from the Silent Generation and a dominant 41 percent from the Baby Boom Generation. Today, it is a different world: The Greatest Generation has all but vanished, and the Silent Generation is down to 13 percent of EVs. The Baby Boomers are still a substantial presence at 32 percent of EVs, though down substantially from their peak of 45 percent in 1982. But the newest generations now dominate the electorate: Generation X at 26 percent of EVs and the Millennial Generation at 28 percent form the majority.
By 2060, the picture will switch dramatically again. The Silent and Baby Boom generations will no longer be on the scene. Gen Xers will be down to 9 percent of EVs, though Millennials will still be at 27 percent. The dominant generations will be Post-Millennials at 31 percent and Post Millennials 2 at 30 percent; Post-Millennials 3 will just be entering the electorate with 3 percent.

Trend 5: The superdiversification of America’s children
Rising diversity strongly interacts with generational change. Each succeeding generation has been, and will be, more diverse than the generations that came before it. Back in 1980, the two newest generations in the population, the Baby Boomers and the Gen Xers, were, respectively, 21 percent and 26 percent minority. Looking at the two newest generations today, the Millennials and the Post-Millennials, the corresponding figures are 44 percent and 49 percent minority. Looking ahead to 2040, the Post-Millennial 2 Generation is projected to be 57 percent minority. In 2060, the Post-Millennial 3 Generation should be 64 percent minority.
As a direct result of this generational succession, every age group in the country will diversify substantially over time. Nothing shows this more dramatically than the superdiversification of America’s children. In 1980, children were 25 percent minority; today, they are 46 percent minority. And diversification will not stop in the future: In 2040, children are projected to be 57 percent minority, and in 2060, children should be 65 percent minority.
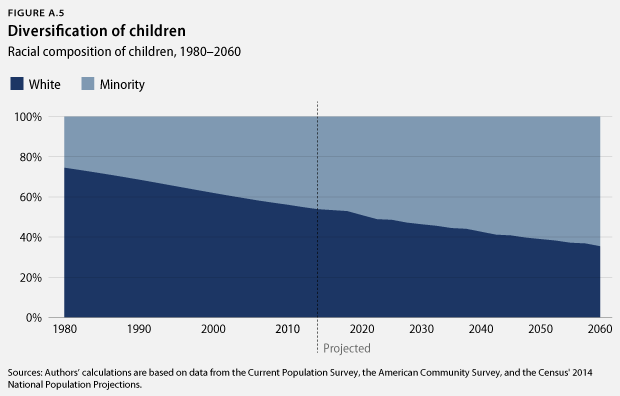
Of course, some states will better exemplify this trend than others. At one extreme, children in a state such as Arizona are 60 percent minority today, and they should be 74 percent and 81 percent minority in 2040 and 2060, respectively. At the other end of the spectrum, children in a state such as Iowa are just 11 percent minority today and should only reach 21 percent and 27 percent minority in 2040 and 2060, respectively.
Trend 6: The graying of America
The age structure of the U.S. population has changed significantly over time, shifting toward an older age structure. This is in large part due to the Baby Boom Generation, which—while not the largest generation in terms of absolute size, as Millennials are about the same size—was the largest generation in relation to population size when it emerged. Since then, fertility declines have cut down on generation sizes relative to population size.
Back in 1980, 49 percent of the population was under age 30—27 percent was under age 18, and 22 percent was ages 18 to 29. Fifteen percent was ages 30 to 39, 10 percent was ages 40 to 49, 14 percent was ages 50 to 64, and just 11 percent was over age 65. Today, 40 percent are under age 30—with 24 percent under age 18 and 16 percent ages 18 to 29. Fourteen percent are, respectively, ages 30 to 39 and ages 40 to 49. Seniors are now up to 15 percent, and the 50- to 64-year-old age group adds 17 percent, for a total of 33 percent who are ages 50 and older. This compares with 26 percent in 1980.
The aging of the population will continue in the future. By 2060, those ages 65 and older are projected to outnumber those under age 18 by 23 percent to 20 percent. Those ages 50 to 64 should be 18 percent, for a total of 42 percent ages 50 and older. Eighteen- to 29-year-olds should be 14 percent, and 30- to 39-year-olds and 40- to 49-year-olds should be 12 percent each.

These shifts have had—and will have—an even more dramatic effect on the age distribution of EVs. In 1980, 29 percent of EVs were ages 18 to 29, 21 percent were ages 50 to 64, and 16 percent were ages 65 and older. Today, 18- to 29-year-old EVs are down to 21 percent, 50- to 64-year-olds are up to 23 percent, and seniors are up to 21 percent. By 2060, those ages 65 and older are projected to be 29 percent and those ages 50 to 64 should be 23 percent, for a total of 52 percent ages 50 and older. Eighteen- to 29-year-olds are expected to be 17 percent and 30- to 39-year-olds should be 15 percent, for a total of 33 percent under age 40. Note that the 2060 projections almost exactly reverse the 1980 figures on 18- to 29-year-olds and seniors. Twenty-nine percent of 18- to 29-year-old EVs in 1980 becomes 17 percent in 2060; 16 percent senior EVs in 1980 becomes 29 percent in 2060.
Trend 7: The diversification of the gray
There is no doubt that diversification has been proceeding faster with younger age groups, particularly children, than with seniors. However, diversification through generational replacement is having, and will have, strong effects on seniors as well. In 1980, seniors were only 11 percent minority. Today, seniors are 22 percent minority. And in 2060, minorities are projected to be close to half—45 percent—of seniors. Thus, the future “seniorization” of the EV population described in trend 6 should not be confused with a “white seniorization” of EVs. In fact, three-quarters of the growth in the senior share of EVs to 2040—when the level of white seniors will peak—is projected to be from minority seniors, and over the entire span to 2060, minorities should be responsible for all of the growth in the senior share of EVs. In short, one cannot fully understand the graying of America without also understanding the diversification of the gray.
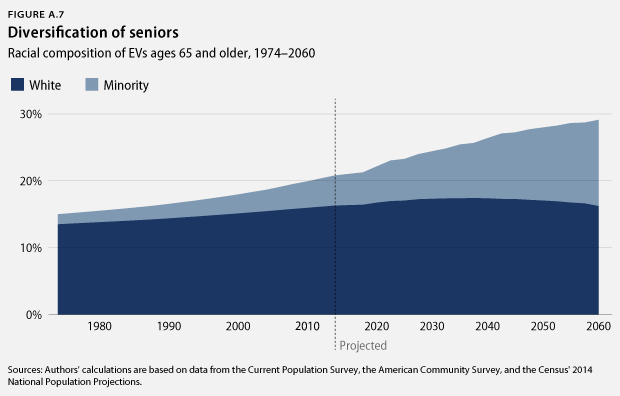
There is naturally some state variation in this, though most states—especially faster-growing, more dynamic states—follow the pattern just described. These include Arizona, Colorado, Florida, Georgia, Nevada, North Carolina, Pennsylvania, Texas, Virginia, and many more. The relatively few exceptions, where growth in white seniors dominates the growth in senior EVs, tend to be heavily white, slow-growing states—such as North Dakota, Ohio, and West Virginia, as well as the upper New England states of Maine, New Hampshire, and Vermont.
Trend 8: The decline of the white working class
One of the more striking demographic changes in the past 40 years has been the decline of the white working class, or noncollege—lacking a four-year degree—population. The first reason for this is obvious: the decline of the white population overall. The second reason is the dramatic shifts in educational attainment over the past several decades. In 1974, about one-third of EVs were high school dropouts, and only 14 percent had a four-year degree or more. By 2014, just 10 percent were high school dropouts, and 30 percent had a four-year degree or more.
Together, these trends have produced a very sharp decline in the white working-class share of EVs. In 1974, 73 percent of all EVs were white working class. Over the next 40 years, that figure dropped 27 points to 46 percent today. The drop was actually a bit sharper, by a couple of percentage points, among AVs from the white working class over comparable time periods.
Every state has been affected by this ongoing decline in the white working class. Some states even experienced declines of 30 points or more in white working-class EVs over this time period, including California, Nevada, Arizona, Colorado, New Jersey, Massachusetts, and several others. Many more are in the 20s, and almost all are at least in double digits.
We could not incorporate education into our projections, so we cannot provide any estimates of long-term change in this demographic. However, judging from the continuing rise in educational attainment among young—ages 25 to 29—whites since 2000, as well as the continuing decline in the white population overall, we should expect to see white working-class EVs decline in the short term at about their rate since 2000—approximately 3 points every four-year presidential election cycle. This is very similar to the rate before 2000.

Trend 9: The rise of white college graduates
The story with white college graduates is very different. Despite the ongoing decline in the white share of the population, educational upgrading has been strong enough for white college graduates to actually increase their share of EVs over time. In 1974, just 13 percent of EVs were college-educated whites. Today, that figure has risen to 23 percent. The increase in white college-graduate EVs was larger by a couple of percentage points among AVs over comparable time periods.
Again, every state has been affected by the ongoing rise in white college graduates. The increase has been largest in high-education states such as Colorado—18 points—and Massachusetts—22 points—but many others are in double digits as well, including Kansas, Nebraska, South Dakota, West Virginia, and Wyoming.
As with the white working class, we cannot provide long-range projections for this demographic. But recent educational attainment trends, combined with ongoing race-ethnic shifts, suggest we should see short-term increases of about 1 percentage point every four-year presidential cycle.
Trend 10: The rise of the unmarried electorate
Shifts in family structure have been another momentous demographic change in the past 40 years. On the most basic level, we have seen a rapid decline in the married share of the electorate and a concomitant, rapid rise in the ranks of the unmarried electorate. In 1974, 70 percent of EVs were married and 30 percent were unmarried. Of the unmarried, 18 percent were women and 12 percent were men. Today, unmarried EVs are now nearly as large a group as married EVs—48 percent vs. 52 percent—with unmarried women up 8 points to 26 percent and unmarried men up 10 points to 22 percent. The rise in unmarried voters, however, has lagged behind the increase in unmarried EVs by a couple of points over comparable time periods.

This change has affected every state, with relatively little variance in the level of change across states. Almost all states saw an increase in unmarried EVs in the 10-point to 20-point range, with many clustered tightly between 15 points and 20 points.
As with educational attainment, we could not incorporate marital status into our long-range projections. However, trend data on marital status do indicate continuing, albeit slowing, growth in the unmarried population. These data suggest that, in the short term, we can expect unmarried EVs to increase around 1.5 percentage points over a four-year presidential cycle.
Conclusion
Looking at these 10 trends, it seems like there are several things on which reasonable people from different political and ideological perspectives can agree. The first is that, over the long term, public policy must adjust to the needs of a quite different America. Diversity is spreading everywhere: into new generations, into every age group—even seniors—and into every corner of the country—including such unlikely states as Oklahoma, Kansas, and Utah. Policy, both national and state, must become increasingly diversity oriented or be deemed ineffective. There is simply no way around this.
Second, political parties must compete for the votes of a new America. Given the magnitude of the shifts described here, it is simply not viable for either major political party to cede dominance of emerging constituencies to the other side. Over the long run, there is simply no way around this either.
These two points are strongly related. Policies that actually solve social and economic problems, remedy educational and labor-market deficiencies, and provide avenues for upward mobility are the key to long-term political success. In other words, political parties will ultimately be judged by results, not intentions.
These are long-run points. But the changes detailed here are rapid enough to also have significant political effects in the short term, as we are likely to see in the 2016 election. Some of the trends we have described here—especially growing diversity—appear to constitute a demographic thumb on the scales for Democrats in the short term, but Republicans could take that thumb off the scales in several ways. The strategies each party uses could yield a wide variety of outcomes, but over time, both parties will have to respond to the needs of a very different America. There is no predetermined partisan advantage, only a challenge that is common to both parties.
* Throughout this report, year ranges are inclusive of their first and last years whether they are referred to as, for example, “from 1976 to 1978,” “between 1976 and 1978,” or “the 1976–1978 period.”
Ruy Teixeira is a Senior Fellow at The Century Foundation and the Center for American Progress. William H. Frey is a senior fellow at the Brookings Institution. Robert Griffin is a Senior Research Associate at the Center for American Progress.
No comments:
Post a Comment